
Signal Analyzer
Nikolas Tolvanen / December 26, 2025
This is a project that aims to solve an industrial problem. Marginum has a device that can detect if a removed tissue in brain surgery is healthy tissue or tumorous tissue. The device gives a constant signal, and the signal is high if it detects tumor tissue. The problem was to create software that can be used to analyse this signal data and mark tumor peaks from the data.
Visit GitHub repository
Features
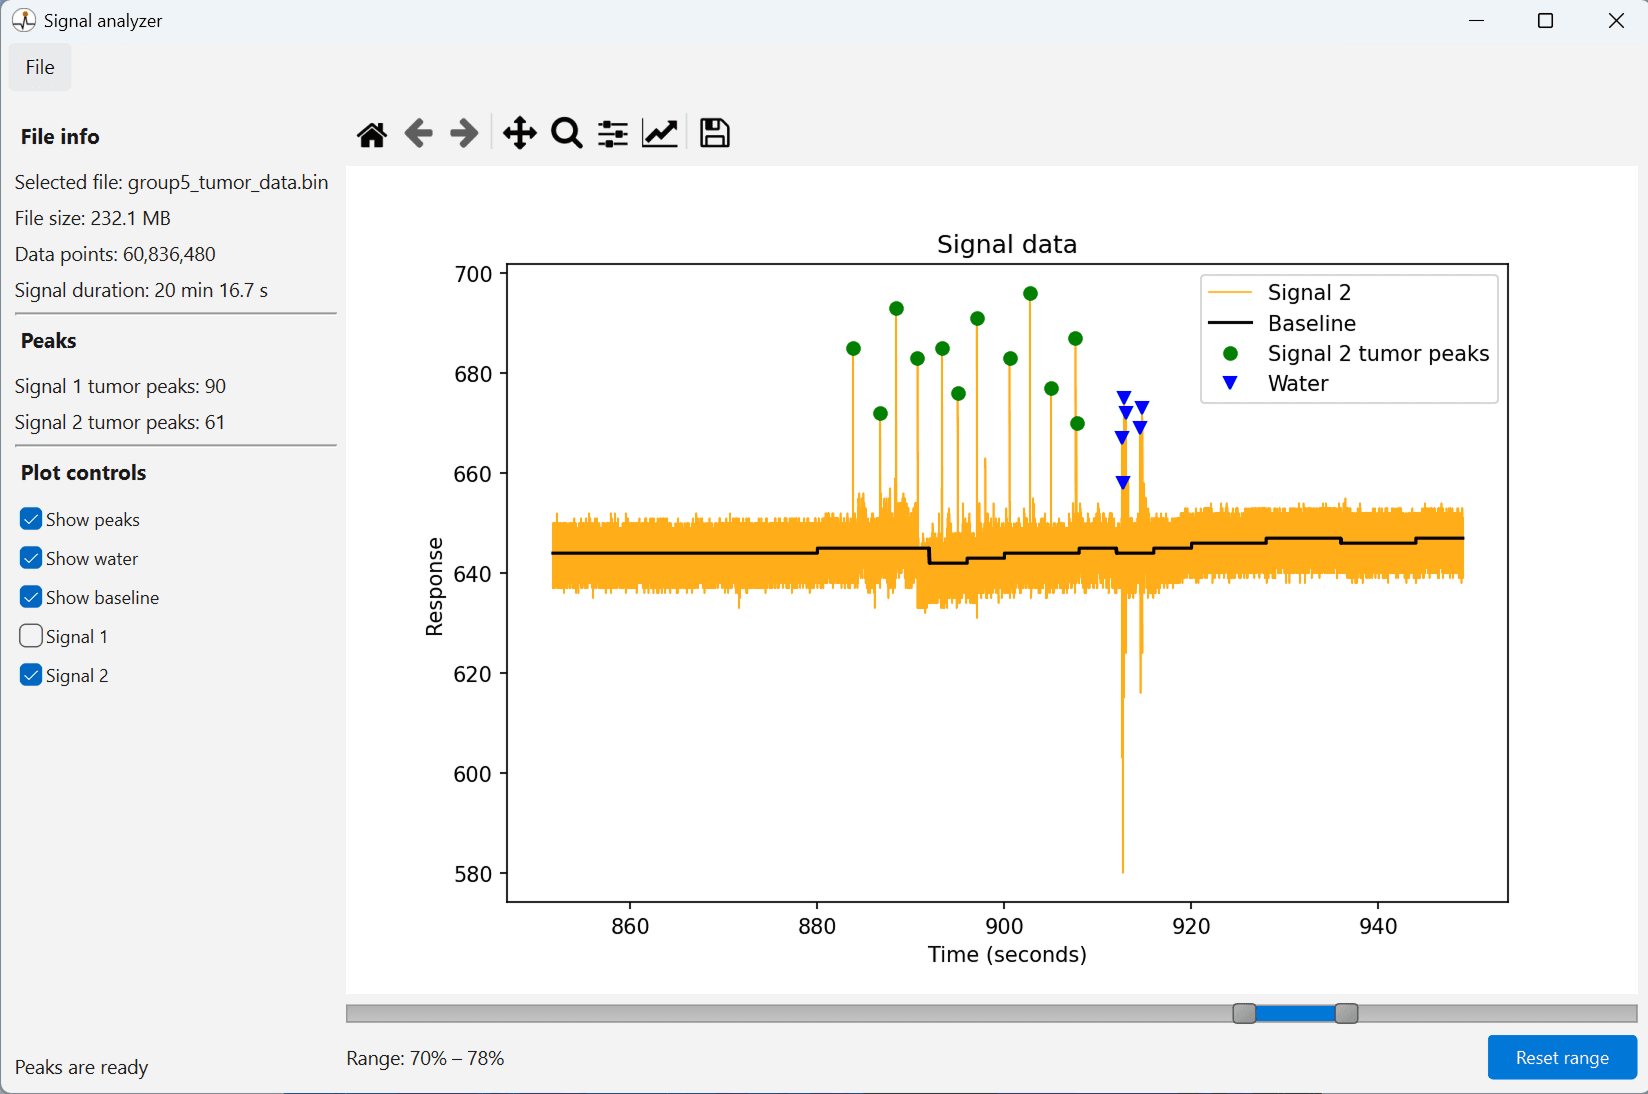
- Plotting of signal data with tumor peaks marked.
- Option to convert a csv file to binary format.
- Display information about the loaded file.
- Progress bar to show peak detection progress.
- Range slider to control the plotted area.
Methods
CSV file conversion to binary format
Because the signal datasets loaded by the software can be large, even multiple gigabytes, the file loading can be slow. To make this file loading faster, the software has a function to convert a csv-format data file to a binary format. Loading a binary-formatted file is noticeably faster than loading a csv formatted file. The software lets users load data in both formats.
More about this file conversion on this blog post.
Min-max downsampling
Sampling rate of the data collection is 50,000 data points per second, and a brain surgery can last for multiple hours. Because of this, a signal can contain millions of values, and an attempt to draw every point at once would make the interface noticeably slower. Instead of drawing every sample, the signal is split into smaller sections, and only the minimum and maximum value from each section is kept. This way, the general shape of the signal line will be preserved, and the plot will be drawn fast enough and be interactive without delays. The down-sampling takes effect only in the visual display and does not influence peak detection or any of the actual calculations over the signal.
Signal baseline calculation
To help with tumor peak detection, the baseline of the signal is calculated. It is not just a single value, because the true baseline of a signal can curve slightly, especially in very large data sets. To calculate the baseline with excellent performance, the full dataset is divided into sections, and a single baseline value is calculated for each section separately. The baseline is calculated by taking the middle 90% of the values on a section and calculating the median value from those values.
Tumor peak detection
Peaks are detected using the find_peaks -method from Scipy Python library. It can find peaks fast and accurately.
Water suction detection
When the Marginum device is only consuming water, the signal goes noticeably above and below the baseline. These peaks need to be separated from the tumor peaks. Water suction is marked with blue triangles, as seen in the screenshot of the software.
Multi-threading
Peak detection itself may take some time depending on the length of the file, which is why it runs in a separate background thread. This way, the interface does not freeze when peak detection is in process, and the user can still control the plotted signal data.
Results
The tissue used for collecting the data for testing the software is not real brain tumor, but instead a fake tissue to mimic it. The tissue has two different concentrations, high and middle. The higher concentration gives a stronger signal.
The Marginum device gives two constant signals, signal 1 and signal 2. In signal 2, the signal peaks are more noticeable and easier to detect. Because of this, the results given by signal 2 are more accurate than the results given by signal 1.
When the higher concentration is used, the peaks are detected more easily, and the difference in the number of peaks between signal 1 and 2 is lower.
| Total tumor size | Concentration | Signal 1 peaks | Signal 2 peaks |
|---|---|---|---|
| 1 ml | High | 82 | 95 |
| 3 ml | High | 344 | 376 |
| 6 ml | High | 593 | 632 |
| 12 ml | High | 1155 | 1206 |
| 1 ml | Middle | 35 | 52 |
| 3 ml | Middle | 110 | 141 |
| 4 ml | Middle | 176 | 331 |
Installation
Download info
| File | signal-analyzer.exe |
| Version number | 1.0 |
| Release date | 17 Dec 2025 |
| File size | 137 MB |
| Platform | Windows 11 |
Privacy policy
Last updated: 17 Dec 2025
The software does not collect, store, or share any personal data. It does not modify files loaded into it. New files created with the software are saved only to the user's local memory. The software does not use third-party analytics, advertising, or tracking services.
Installation instructions for Windows
- Download the executable file from the button below.
- Open the downloaded file.
- Go through the installation process.